Population
8.22BpeopleWorld · 2025Published annual data
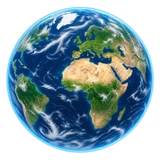
The day/night boundary follows the Sun’s current position, even when rotation is paused. Night lights: NASA’s 2016 composite. Clouds are illustrative imagery.
Live estimates and the latest published world figures.
Population estimates follow adjacent annual World Bank midyear projections, with each annual value placed at July 1, 00:00 UTC. The number moves between these anchors; it is not a live census.
Net change is the difference since the start of each UTC period. It is not a count of registered births or deaths. Missing projection years are left unavailable.
World Bank, Population Estimates and Projections. Published population: 8,215,424,893 · 2025.
Population estimates follow adjacent annual World Bank midyear projections, with each annual value placed at July 1, 00:00 UTC. The number moves between these anchors; it is not a live census.
Net change is the difference since the start of each UTC period. It is not a count of registered births or deaths. Missing projection years are left unavailable.
World Bank, Population Estimates and Projections. Published population: 8,215,424,893 · 2025.
Population estimates follow adjacent annual World Bank midyear projections, with each annual value placed at July 1, 00:00 UTC. The number moves between these anchors; it is not a live census.
Net change is the difference since the start of each UTC period. It is not a count of registered births or deaths. Missing projection years are left unavailable.
World Bank, Population Estimates and Projections. Published population: 8,215,424,893 · 2025.
Annual population growth rate for year t is the exponential rate of growth of midyear population from year t-1 to t, expressed as a percentage. Population is based on the de facto definition of population, which counts all residents regardless of legal status or citizenship.
World Bank · World Development Indicators. Latest published World observation: 2025.
Population density is midyear population divided by land area in square kilometers. Population is based on the de facto definition of population, which counts all residents regardless of legal status or citizenship--except for refugees not permanently settled in the country of asylum, who are generally considered part of the population of their country of origin. Land area is a country's total area, excluding area under inland water bodies, national claims to continental shelf, and exclusive economic zones. In most cases the definition of inland water bodies includes major rivers and lakes.
World Bank · World Development Indicators. Latest published World observation: 2023.
Urban population refers to people living in urban areas as defined by national statistical offices. The data are collected and smoothed by United Nations Population Division.
World Bank · World Development Indicators. Latest published World observation: 2025.
The latest published annual World GDP is spread evenly across the current UTC calendar year. These counters add that constant pace from January 1 and from midnight today. They are estimates of accumulated output, not observed transactions or a forecast.
Annual pace: $118,350,166,039,396 · 2025 · current US$. Leap years use their actual number of seconds.
The latest published annual World GDP is spread evenly across the current UTC calendar year. These counters add that constant pace from January 1 and from midnight today. They are estimates of accumulated output, not observed transactions or a forecast.
Annual pace: $118,350,166,039,396 · 2025 · current US$. Leap years use their actual number of seconds.
Gross domestic product is the total income earned through the production of goods and services in an economic territory during an accounting period. It can be measured in three different ways: using either the expenditure approach, the income approach, or the production approach. This indicator is expressed in current prices, meaning no adjustment has been made to account for price changes over time. This indicator is expressed in United States dollars.
World Bank · World Development Indicators. Latest published World observation: 2025.
Gross domestic product is the total income earned through the production of goods and services in an economic territory during an accounting period. It can be measured in three different ways: using either the expenditure approach, the income approach, or the production approach. The core indicator has been divided by the general population to achieve a per capita estimate.This indicator is expressed in current prices, meaning no adjustment has been made to account for price changes over time. This indicator is expressed in United States dollars.
World Bank · World Development Indicators. Latest published World observation: 2025.
Inflation as measured by the consumer price index reflects the annual percentage change in the cost to the average consumer of acquiring a basket of goods and services that may be fixed or changed at specified intervals, such as yearly.
World Bank · World Development Indicators. Latest published World observation: 2025.
Life expectancy at birth indicates the number of years a newborn infant would live if prevailing patterns of mortality at the time of its birth were to stay the same throughout its life.
World Bank · World Development Indicators. Latest published World observation: 2024.
Under-five mortality rate is the probability per 1,000 that a newborn baby will die before reaching age five, if subject to age-specific mortality rates of the specified year.
World Bank · World Development Indicators. Latest published World observation: 2024.
Level of current health expenditure expressed as a percentage of GDP. Estimates of current health expenditures include healthcare goods and services consumed during each year. This indicator does not include capital health expenditures such as buildings, machinery, IT and stocks of vaccines for emergency or outbreaks.
World Bank · World Development Indicators. Latest published World observation: 2023.
Forest area (% of land area) is the share of total land area that is under natural or planted stands of trees of at least 5 meters in situ, whether productive or not, and excludes tree stands in agricultural production systems (for example, in fruit plantations and agroforestry systems) and trees in urban parks and gardens.
World Bank · World Development Indicators. Latest published World observation: 2023.
Access to electricity is the percentage of population with access to electricity. Electrification data are collected from industry, national surveys and international sources.
World Bank · World Development Indicators. Latest published World observation: 2024.
Renewable energy consumption is the share of renewable energy in total final energy consumption.
World Bank · World Development Indicators. Latest published World observation: 2020.
Prevalence of undernourishment is the percentage of the population whose habitual food consumption is insufficient to provide the dietary energy levels that are required to maintain a normal active and healthy life. Data showing as 2.5 may signify a prevalence of undernourishment below 2.5%.
World Bank · World Development Indicators. Latest published World observation: 2023.
Cereal yield, measured as kilograms per hectare of harvested land, includes wheat, rice, maize, barley, oats, rye, millet, sorghum, buckwheat, and mixed grains. Production data on cereals relate to crops harvested for dry grain only. Cereal crops harvested for hay or harvested green for food, feed, or silage and those used for grazing are excluded. The FAO allocates production data to the calendar year in which the bulk of the harvest took place. Most of a crop harvested near the end of a year will be used in the following year.
World Bank · World Development Indicators. Latest published World observation: 2024.
The percentage of people using at least basic water services. This indicator encompasses both people using basic water services as well as those using safely managed water services. Basic drinking water services is defined as drinking water from an improved source, provided collection time is not more than 30 minutes for a round trip. Improved water sources include piped water, boreholes or tubewells, protected dug wells, protected springs, and packaged or delivered water.
World Bank · World Development Indicators. Latest published World observation: 2024.
The percentage of people using drinking water from an improved source that is accessible on premises, available when needed and free from fecal and priority chemical contamination. Improved water sources include piped water, boreholes or tubewells, protected dug wells, protected springs, and packaged or delivered water.
World Bank · World Development Indicators. Latest published World observation: 2024.
The percentage of people using at least basic sanitation services, that is, improved sanitation facilities that are not shared with other households. This indicator encompasses both people using basic sanitation services as well as those using safely managed sanitation services. Improved sanitation facilities include flush/pour flush to piped sewer systems, septic tanks or pit latrines; ventilated improved pit latrines, composting toilets or pit latrines with slabs.
World Bank · World Development Indicators. Latest published World observation: 2024.
Internet users are individuals who have used the Internet (from any location) in the last 3 months. The Internet can be used via a computer, mobile phone, personal digital assistant, games machine, digital TV etc.
World Bank · World Development Indicators. Latest published World observation: 2025.
Adult literacy rate is the percentage of people ages 15 and above who can both read and write with understanding a short simple statement about their everyday life.
World Bank · World Development Indicators. Latest published World observation: 2024.
Follow your curiosity. Explore the numbers behind our world.
World · 2025Published annual data
World · 2025Published annual data
World · 2023Published annual data
World · 2025Published annual data
World · 2025Published annual data
World · 2025Published annual data
World · 2025Published annual data
World · 2024Published annual data
World · 2024Published annual data
World · 2023Published annual data
World · 2023Published annual data
World · 2024Published annual data
World · 2020Published annual data
World · 2023Published annual data
World · 2024Published annual data
World · 2024Published annual data
World · 2024Published annual data
World · 2024Published annual data
World · 2025Published annual data
World · 2024Published annual data